Chart patterns with measured success rates
chartval back-tests 17 classic chart patterns across 273 stocks, ETFs and cryptocurrencies, over 370,000 historical pattern cases in total. Each page states the measured share of cases that moved 5 percent in the signal direction before moving 5 percent against it, honest even when the number is unspectacular.
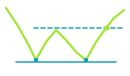
53 of 100 cases worked (17,183 occurrences)
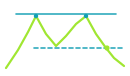
48 of 100 cases worked (17,637 occurrences)

49 of 100 cases worked (1,034 occurrences)
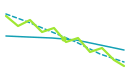
41 of 100 cases worked (1,081 occurrences)

31 of 100 cases worked (39,306 occurrences)
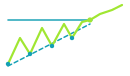
45 of 100 cases worked (7,092 occurrences)
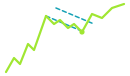
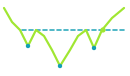
49 of 100 cases worked (6,479 occurrences)
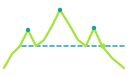
41 of 100 cases worked (6,673 occurrences)
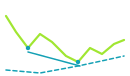
38 of 100 cases worked (10,313 occurrences)
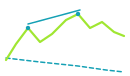
29 of 100 cases worked (13,933 occurrences)
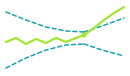
48 of 100 cases worked (6,791 occurrences)
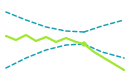
40 of 100 cases worked (6,015 occurrences)
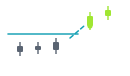
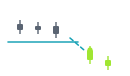
26 of 100 cases worked (2,877 occurrences)
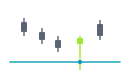
35 of 100 cases worked (4,068 occurrences)
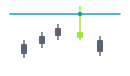
27 of 100 cases worked (5,057 occurrences)
Note: All content on chartval is technical-analysis information, not investment advice and not a recommendation to buy or sell. Trading securities and crypto assets involves risk up to total loss. Past pattern statistics are not a reliable indicator of future results.