← All patterns · Deutsche Version
Death Cross: definition and measured success rate
Data as of 16.09.2026 · back-test since 05/2020
A death cross occurs when a shorter-term moving average (typically the 50-day) crosses below a longer-term moving average (typically the 200-day). It signals that recent weakness has overtaken the long-term trend and is read as a warning of a broader downtrend. In chartval's back-test, it worked in 41 of 100 comparable cases (1,081 occurrences).
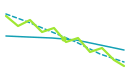
How does a death cross form?
After a topping phase, recent prices fall faster than the long-term average. The faster 50-day average rolls over and crosses below the 200-day average. Like its bullish counterpart, the cross confirms a change that started earlier rather than predicting a new one.
How reliable is the death cross?
In chartval's historical back-test across 273 stocks, ETFs and cryptocurrencies, the death cross reached a 5 percent move in the signal direction before a 5 percent counter-move in 41 of 100 cases (1,081 occurrences evaluated since 05/2020; data as of 16.09.2026). Past statistics are not a reliable indicator of future results.
Measurement: a case counts as a hit when price moved 5 percent in the signal direction before moving 5 percent against it, based on closing prices, within a maximum of 120 candles after the trigger.
How chartval detects the pattern
chartval flags a death cross when the 50-period average closes below the 200-period average with a fresh crossover, and grades the signal by the gap between the averages and the trend context. chartval scans 273 stocks, ETFs and cryptocurrencies daily; every signal names an entry, a target and the level at which the setup is invalidated.
See where this pattern is forming right now
Open the app →Note: All content on chartval is technical-analysis information, not investment advice and not a recommendation to buy or sell. Trading securities and crypto assets involves risk up to total loss. Past pattern statistics are not a reliable indicator of future results.