← All patterns · Deutsche Version
Double Top: definition and measured success rate
Data as of 16.09.2026 · back-test since 09/2019
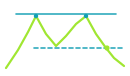
A double top is a bearish reversal pattern in which price rises twice to roughly the same resistance level and fails both times, forming an M shape. The pattern completes when price breaks below the neckline, the interim low between the two highs. In chartval's back-test, it worked in 48 of 100 comparable cases (17,637 occurrences).
How does a double top form?
Buyers drive price to a level where selling pressure appears. After a pullback, a second attempt stalls at almost the same level. The failed second attempt shows demand fading. A close below the neckline breaks the sequence of higher highs and confirms the reversal.
How reliable is the double top?
In chartval's historical back-test across 273 stocks, ETFs and cryptocurrencies, the double top reached a 5 percent move in the signal direction before a 5 percent counter-move in 48 of 100 cases (17,637 occurrences evaluated since 09/2019; data as of 16.09.2026). Past statistics are not a reliable indicator of future results.
Measurement: a case counts as a hit when price moved 5 percent in the signal direction before moving 5 percent against it, based on closing prices, within a maximum of 120 candles after the trigger.
How chartval detects the pattern
chartval identifies double tops with confirmed swing pivots: two highs within a volatility-adjusted tolerance, a fresh second high, and a close below the neckline. Every detection states an entry, a target and an invalidation level. chartval scans 273 stocks, ETFs and cryptocurrencies daily; every signal names an entry, a target and the level at which the setup is invalidated.
See where this pattern is forming right now
Open the app →Note: All content on chartval is technical-analysis information, not investment advice and not a recommendation to buy or sell. Trading securities and crypto assets involves risk up to total loss. Past pattern statistics are not a reliable indicator of future results.