← All patterns · Deutsche Version
Bearish Bollinger Squeeze: definition and measured success rate
Data as of 16.09.2026 · back-test since 12/2020
A bearish Bollinger squeeze occurs when the Bollinger Bands narrow to an unusually tight range and price then breaks down below the lower band region. Volatility compression resolves into a downward expansion. In chartval's back-test, it worked in 40 of 100 comparable cases (6,015 occurrences).
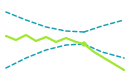
How does a bearish bollinger squeeze form?
After weeks of shrinking ranges the bands contract to a percentile-low width. Energy builds while direction stays open. The signal exists only once price leaves the compression downward, with the same mechanics as the bullish case, mirrored.
How reliable is the bearish bollinger squeeze?
In chartval's historical back-test across 273 stocks, ETFs and cryptocurrencies, the bearish bollinger squeeze reached a 5 percent move in the signal direction before a 5 percent counter-move in 40 of 100 cases (6,015 occurrences evaluated since 12/2020; data as of 16.09.2026). Past statistics are not a reliable indicator of future results.
Measurement: a case counts as a hit when price moved 5 percent in the signal direction before moving 5 percent against it, based on closing prices, within a maximum of 120 candles after the trigger.
How chartval detects the pattern
chartval measures band width against its own recent history (percentile-based rather than a fixed threshold) and confirms only fresh downward breakouts from a genuine squeeze. chartval scans 273 stocks, ETFs and cryptocurrencies daily; every signal names an entry, a target and the level at which the setup is invalidated.
See where this pattern is forming right now
Open the app →Note: All content on chartval is technical-analysis information, not investment advice and not a recommendation to buy or sell. Trading securities and crypto assets involves risk up to total loss. Past pattern statistics are not a reliable indicator of future results.