← All patterns · Deutsche Version
Bull Flag: definition and measured success rate
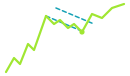
A bull flag is a continuation pattern in which a steep advance (the pole) is followed by a short, narrow consolidation (the flag). A break above the flag's high signals that the original advance is resuming.
How does a bull flag form?
After a sharp rise, early buyers take profits while new buyers wait. The result is a quiet, slightly drifting range on falling volume. Because sellers cannot push price meaningfully lower, the pause resolves upward once price clears the flag's interim high.
How reliable is the bull flag?
chartval publishes reliability numbers only once at least 100 historical cases are available for a pattern. This pattern has not yet crossed that threshold.
How chartval detects the pattern
chartval requires a measurable pole, a proportionally small consolidation, and a fresh close above the flag high, then states entry, target and invalidation based on current volatility. chartval scans 273 stocks, ETFs and cryptocurrencies daily; every signal names an entry, a target and the level at which the setup is invalidated.
See where this pattern is forming right now
Open the app →Note: All content on chartval is technical-analysis information, not investment advice and not a recommendation to buy or sell. Trading securities and crypto assets involves risk up to total loss. Past pattern statistics are not a reliable indicator of future results.