← All patterns · Deutsche Version
Hammer Candlestick: definition and measured success rate
Data as of 16.09.2026 · back-test since 11/2020
A hammer is a single-candle reversal signal: price sells off sharply during the session but closes near its high, leaving a long lower shadow and a small body. Buyers absorbed the entire intraday sell-off before the close. In chartval's back-test, it worked in 35 of 100 comparable cases (4,068 occurrences).
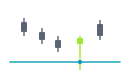
How does a hammer candlestick form?
During a decline, sellers push price far below the open. Instead of closing weak, the market recovers the full range. That is the fingerprint of real buying interest at that level. Context decides the quality: a hammer at a tested support level after a decline carries the most weight.
How reliable is the hammer candlestick?
In chartval's historical back-test across 273 stocks, ETFs and cryptocurrencies, the hammer candlestick reached a 5 percent move in the signal direction before a 5 percent counter-move in 35 of 100 cases (4,068 occurrences evaluated since 11/2020; data as of 16.09.2026). Past statistics are not a reliable indicator of future results.
Measurement: a case counts as a hit when price moved 5 percent in the signal direction before moving 5 percent against it, based on closing prices, within a maximum of 120 candles after the trigger.
How chartval detects the pattern
chartval requires a long lower shadow relative to the body, a close near the session high, a preceding decline and nearby support, and grades the candle by these proportions. chartval scans 273 stocks, ETFs and cryptocurrencies daily; every signal names an entry, a target and the level at which the setup is invalidated.
See where this pattern is forming right now
Open the app →Note: All content on chartval is technical-analysis information, not investment advice and not a recommendation to buy or sell. Trading securities and crypto assets involves risk up to total loss. Past pattern statistics are not a reliable indicator of future results.